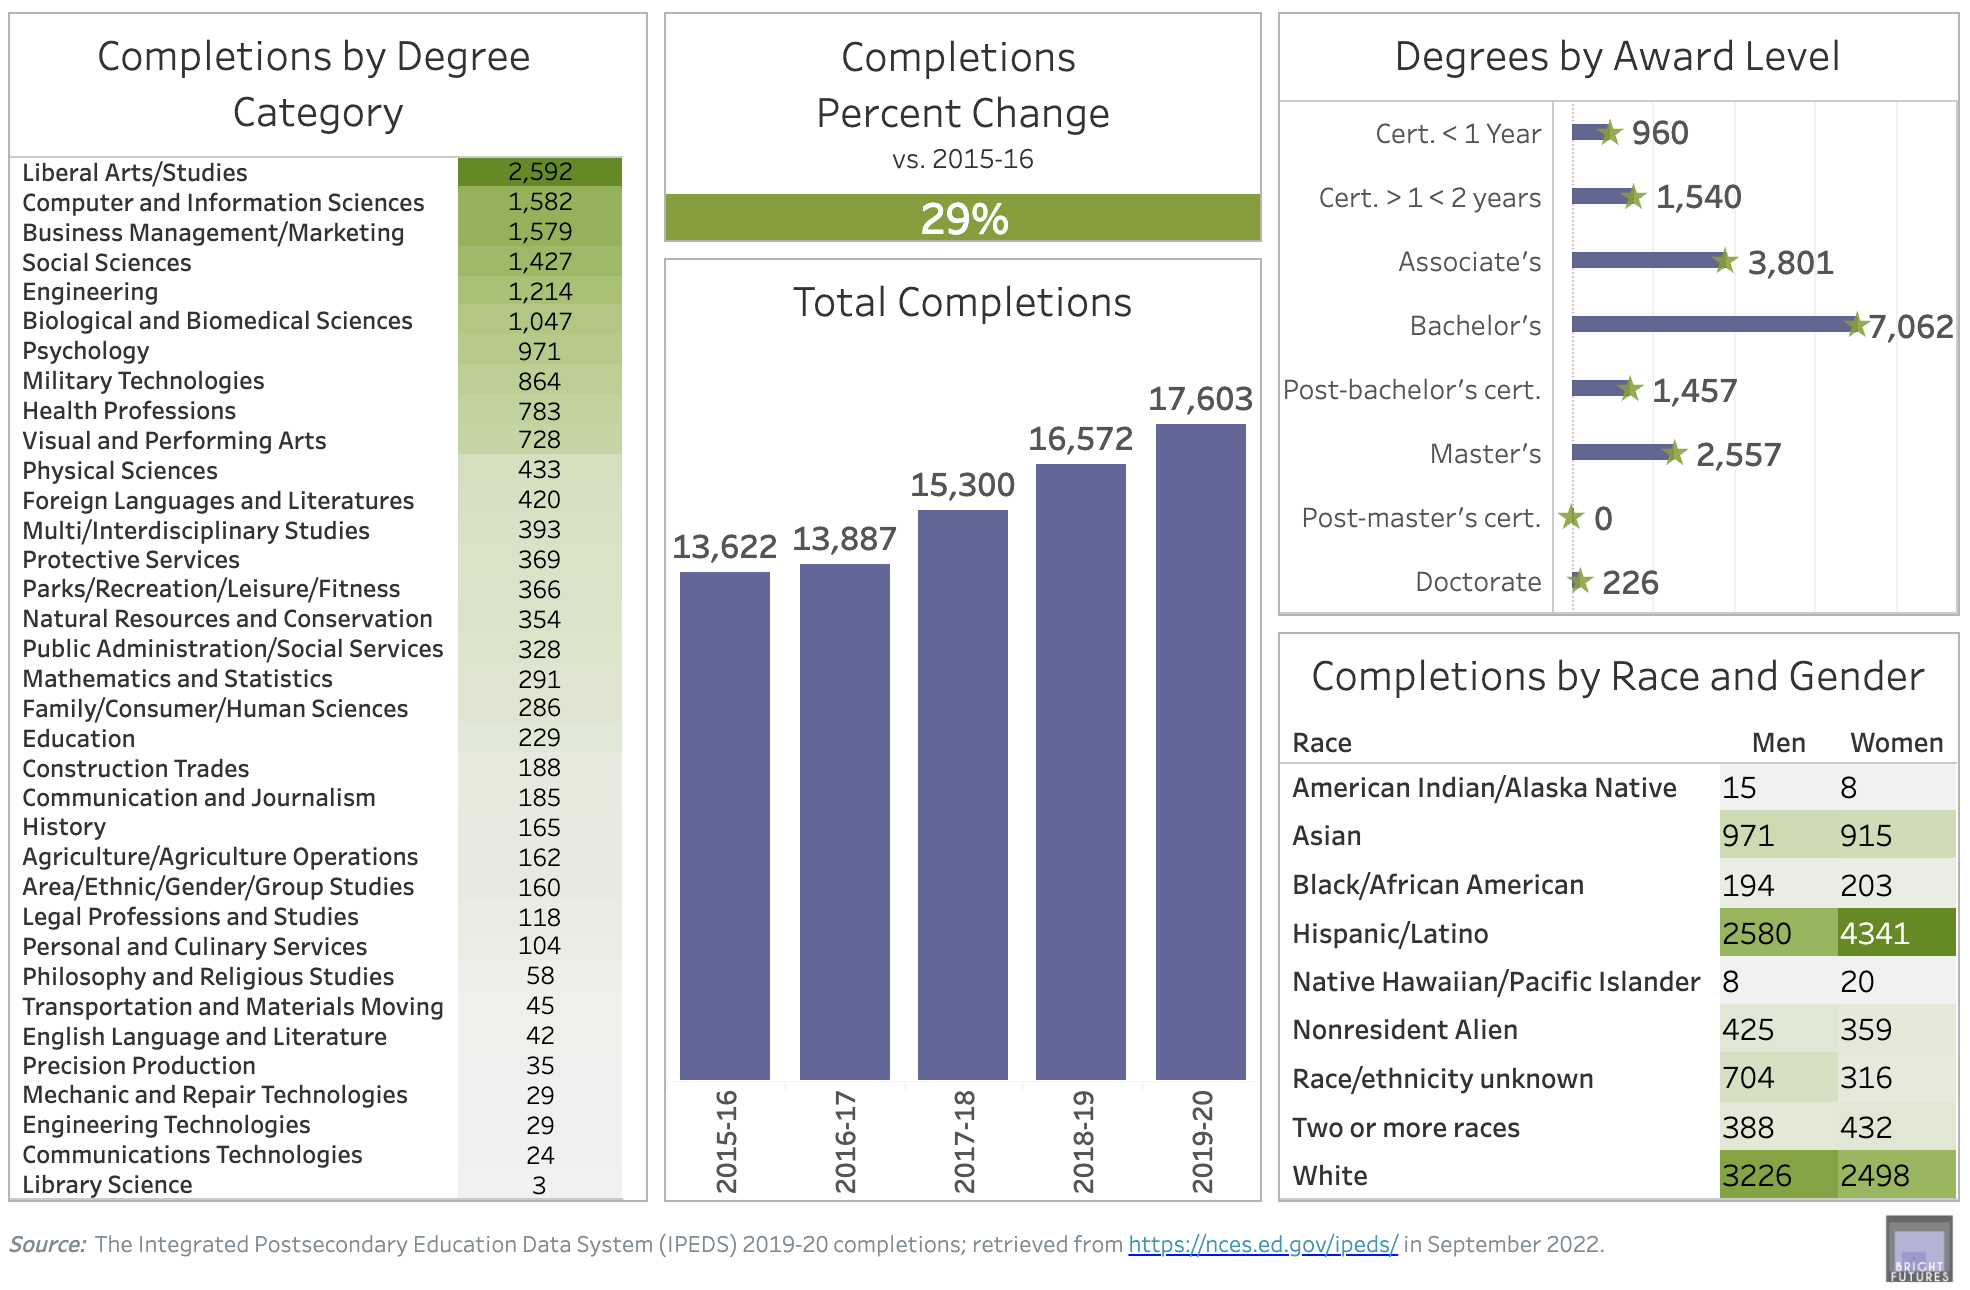
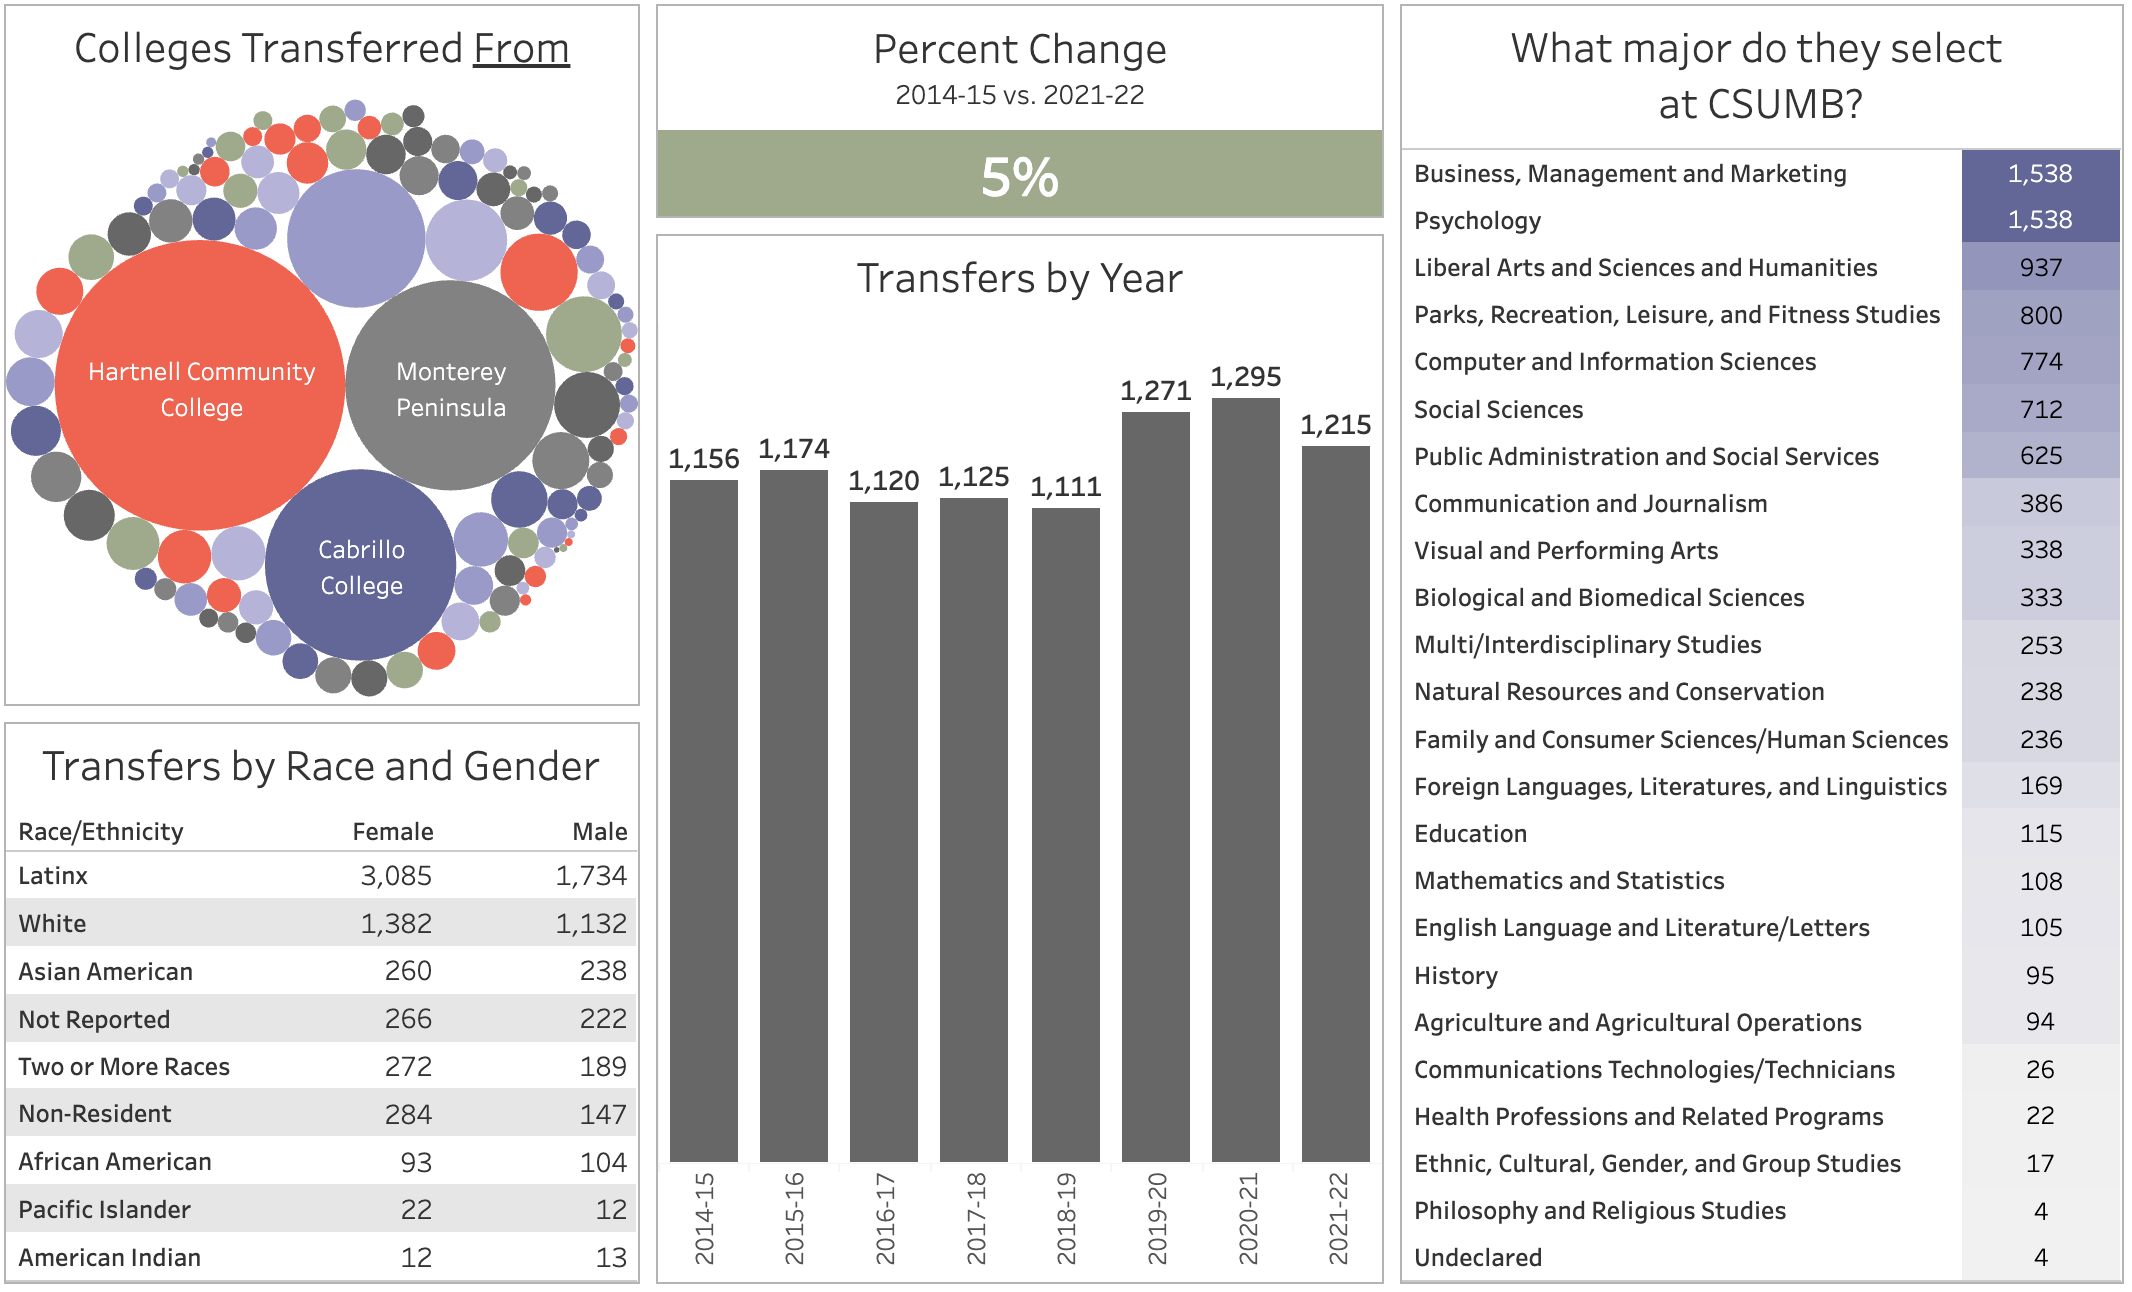
Using detailed regional data helps us to identify opportunities and strategies to best support the students in our community. The visualizations below are interactive and can be filtered in a variety of ways that are helpful for understanding local educational journeys.


